#360Stats: Shane Watson's Test career by numbers

Mohandas Menon 20:28 06/09/2015
  • Facebook
  • Twitter
  • Mail
  • Pinterest
  • LinkedIn
  • Facebook
  • Twitter
  • WhatsApp
  • Pinterest
  • LinkedIn
  • Shane Watson scored a Test high 176 runs for Australia.

    The cricket world was just getting over the retirement of the two greats Kumar Sangakkara and Michael Clarke on the same day, now have another one in the form of Shane Watson, thrust upon them in a matter of a fortnight. Thanks to his all-round abilities, he was widely regarded as a largely limited overs player. But Shane Watson broke into the Test side on the back of some solid performances even in the longer version and was soon a regular in the side.  However injuries and inconsistent form probably jaded Watson faster to announce his retirement from Tests admitting he didn’t have 'the fight' in him to reclaim his spot in the Australian Test team. However, Watson only 34 years, still has age on his side and will continue to play in the limited-over version.

    – UAE: Javed welcomes chance to qualify for 2016 Asia Cup
    – ENGvAUS: Visitors win second ODI amidst Stokes controversy

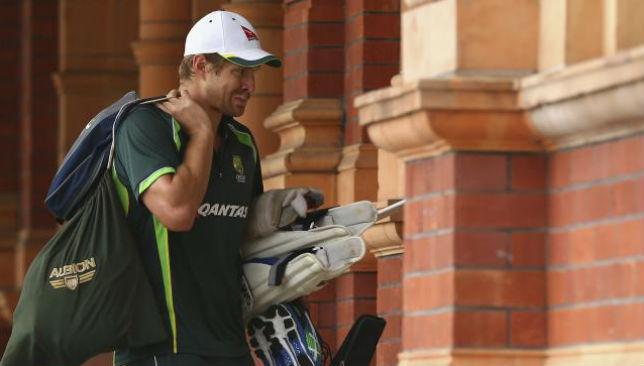
    Watson, who was ruled out of the ongoing one-day series against England with another injury to his troublesome right calf, told teammates of his decision early this morning. It was a disastrous tour for the injury prone all-rounder, who played in the opening Test at Cardiff (his 59th), which has now turned out to be his Test career’s final match.

    Watson born in Ipswich, Queensland on June 17, 1981, made his mark as a right hand batsman and as a right arm fast medium bowler for Tasmania from January 2001 to March 2004. He then returned to his home state Queensland from November 2004 to March 2009. Then since November 2010 to date he has been playing for New South Wales. He made his Test debut in January 2005 at the SCG against Pakistan. 

    In the history of Test cricket only 22 players have the distinction of making over 3000 runs and also claiming over 75 wickets. And for Australia only three have done it. See the table below:

    Australian Test all-rounders with 3000+ runs and 75 or more wickets

    Australians Tests Inns NO Runs HS Ave 100 50 Inns Overs Runs Wkts Best Ave 5wi
    Steve Waugh 168 260 46 10927 200 51.06 32 50 150 1300.5 3445 92 528 37.45 3
    Shane Warne 145 199 17 3154 99 17.33 0 12 273 6784.1 17995 708 871 25.42 37
    Shane Watson 59 109 3 3731 176 35.20 4 24 93 915.5 2526 75 633 33.68 3

    The rundown of Shane Watson Test career

    Opponents Tests Inns NO Runs HS Ave 100 50 Inns Overs Runs Wkts Best Ave 5wi
    v England 19 37 2 1487 176 42.48 2 10 26 230.1 620 9 1 68.88 0
    v ICC World XI 1 2 0 34 24 17.00 0 0 1 6 38 0 0
    v India 13 25 0 778 126 31.12 1 5 20 225.2 645 17 442 37.94 0
    v New Zealand 2 4 0 83 65 20.75 0 1 4 26 102 2 235 51.00 0
    v Pakistan 6 11 1 441 120* 44.10 1 2 10 102.5 302 17 633 17.76 2
    v South Africa 4 8 0 195 88 24.37 0 1 7 54.5 160 8 517 20.00 1
    v Sri Lanka 5 8 0 205 83 25.62 0 1 8 125.4 256 9 311 28.44 0
    v West Indies 9 14 0 508 96 36.28 0 4 17 145 403 13 230 31.00 0

    In Country Tests Inns NO Runs HS Ave 100 50 Inns Overs Runs Wkts Best Ave 5wi
    in Australia 27 50 3 1867 120* 39.72 2 13 42 445 1260 32 230 39.37 0
    in England 11 21 0 771 176 36.71 1 4 17 136.2 392 13 633 30.15 2
    in India 9 17 0 540 126 31.76 1 3 12 140.4 401 12 442 33.41 0
    in New Zealand 1 2 0 77 65 38.50 0 1 2 11 48 0 0
    in South Africa 3 6 0 160 88 26.66 0 1 5 36.5 114 7 517 16.28 1
    in Sri Lanka 3 5 0 87 36 17.40 0 0 5 75 144 7 311 20.57 0
    in West Indies 5 8 0 229 56 28.62 0 2 10 71 167 4 13 41.75 0
    Home/Away Tests Inns NO Runs HS Ave 100 50 Inns Overs Runs Wkts Best Ave 5wi
    home 27 50 3 1867 120* 39.72 2 13 42 445 1260 32 230 39.37 0
    away 30 55 0 1800 176 32.72 2 11 47 441 1149 32 517 35.90 1
    neutral 2 4 0 64 31 16.00 0 0 4 29.5 117 11 633 10.63 2

    Each year Tests Inns NO Runs HS Ave 100 50 Inns Overs Runs Wkts Best Ave 5wi
    2005 3 4 0 81 31 20.25 0 0 4 31 123 2 125 61.5 0
    2008 5 9 0 176 78 19.55 0 1 10 130.4 375 12 442 31.25 0
    2009 7 12 1 716 120* 65.09 1 6 9 89 290 9 230 32.22 0
    2010 11 22 1 897 126 42.71 1 8 17 162.5 514 19 633 27.05 2
    2011 6 11 0 265 88 24.09 0 1 9 113.5 267 14 517 19.07 1
    2012 6 11 0 346 83 31.45 0 3 1 123.4 295 6 120 49.16 0
    2013 12 24 1 810 176 35.21 2 3 7 130.1 296 6 1 49.33 0
    2014 5 10 0 258 52 25.80 0 1 8 77.4 209 3 134 69.66 0
    2015 4 6 0 182 81 30.33 0 1 5 57 157 4 258 39.25 0

    In each innings   Inns NO Runs HS Ave 100 50 Inns Overs Runs Wkts Best Ave 5wi
    1st   39 0 1409 176 36.12 2 9 19 206.1 579 13 257 44.53 0
    2nd   20 0 807 96 40.35 0 6 32 345.3 999 39 633 25.61 3
    3rd   36 1 1128 120* 32.22 2 7 17 176.1 470 10 442 47 0
    4th   14 2 387 83* 32.25 0 2 25 188 478 13 219 36.76 0
      Tests Inns NO Runs HS Ave SR 100 50 Cts Inns Overs Runs Wkts Best Ave 5wi
    Test total 59 109 3 3731 176 35.2 52.59 4 24 45 93 915.5 2526 75 633 33.68 3

    Recommended