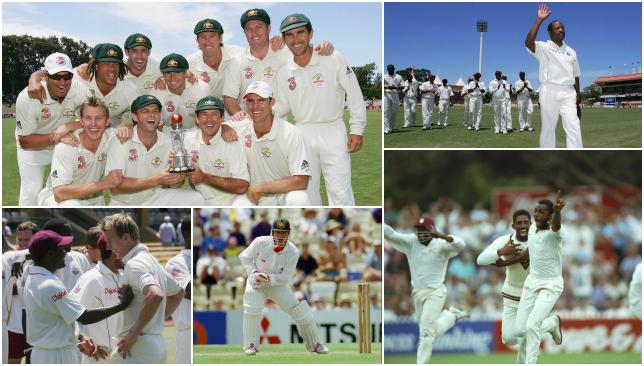
As hosts Australia prepare to take on the once all-conquering West Indies in a three match Test series that begins in Hobart this Thursday, Sport360's resident statistician Mohandas Menon looks at the history behind the two teams' rivalry.
The odds are firmly against the visitors claiming the Frank Worrell Trophy, more so after they were trashed in their only first-class warm-up at Brisbane by a Cricket Australia XI which won by 10 wickets.
Since winning six Tests in a row from July 2012 to March 2013, the West Indies have won just four of their last 20 matches, losing 13.
– INSIDE STORY: How Sharjah helped curate UAE cricket
– #360view: Kohli's aggression drives young India forward
– FOLLOW: Live cricket scores from all around the world
To date, the two sides have played 113 Tests against each other since the first in 1930 – nearly 86 year ago.
This will be the 27th series between them, with Australia winning 16 to West Indies’ eight. Four of West Indies’ series victories have come in Australia: all coming during their golden age from the late 1980s into the early 1990s.
| Match results | ||||||
|---|---|---|---|---|---|---|
| Venue | Tests | Aus | WI | Drawn | Tie | Period |
| In Australia | 63 | 35 | 18 | 9 | 1 | 1930-2009 |
| In West Indies | 50 | 21 | 14 | 15 | 0 | 1955-2015 |
| Total | 113 | 56 | 32 | 24 | 1 | 1930-2015 |
| Series results | |||||
|---|---|---|---|---|---|
| Venue | Series | Aus | WI | Drawn | Period |
| In Australia | 14 | 9 | 4 | 1 | 1930-2009 |
| In West Indies | 12 | 7 | 4 | 1 | 1955-2015 |
| Total | 26 | 16 | 8 | 2 | 1930 -2015 |
Series by series results in Australia
| # | Month, Year | Tests | Aus | WI | Drawn | Tie | Series won by |
|---|---|---|---|---|---|---|---|
| 1 | Dec 1930 to Mar 1931 | 5 | 4 | 1 | 0 | 0 | Australia |
| 2 | Nov 1951 to Jan 1952 | 5 | 4 | 1 | 0 | 0 | Australia |
| 3 | Dec 1960 to Feb 1961 | 5 | 2 | 1 | 1 | 1 | Australia |
| 4 | Dec 1968 to Feb 1969 | 5 | 3 | 1 | 1 | 0 | Australia |
| 5 | Nov 1975 to Feb 1976 | 6 | 5 | 1 | 0 | 0 | Australia |
| 6 | Dec 1979 to Jan 1980 | 3 | 0 | 2 | 1 | 0 | West Indies |
| 7 | Dec 1981 to Feb 1982 | 3 | 1 | 1 | 1 | 0 | Drawn |
| 8 | Nov 1984 to Jan 1985 | 5 | 1 | 3 | 1 | 0 | West Indies |
| 9 | Nov 1988 to Feb 1989 | 5 | 1 | 3 | 1 | 0 | West Indies |
| 10 | Nov 1992 to Feb 1993 | 5 | 1 | 2 | 2 | 0 | West Indies |
| 11 | Nov 1996 to Feb 1997 | 5 | 3 | 2 | 0 | 0 | Australia |
| 12 | Nov 2000 to Jan 2001 | 5 | 5 | 0 | 0 | 0 | Australia |
| 13 | Nov 2005 | 3 | 3 | 0 | 0 | 0 | Australia |
| 14 | Nov 2009 to Dec 2009 | 3 | 2 | 0 | 1 | 0 | Australia |
Series summary in Australia:
Total series: 14, Australia won 9, West Indies won 4, Drawn 1
Highest team totals
Australia
| 758-8d | at Kingston | June 1955 | (Won) |
|---|---|---|---|
| 668 | at Bridgetown | May 1955 | (Drawn) |
| 650-6d | at Bridgetown | May 1965 | (Drawn) |
West Indies
| 616 | at Adelaide | Jan 1969 | (Drawn) |
|---|---|---|---|
| 606 | at Sydney | Jan 1993 | (Drawn) |
| 585 | at Perth | Dec 1975 | (Won) |
Lowest team totals
Australia
| 76 | at Perth | Nov 1984 | (Lost) |
|---|---|---|---|
| 82 | at Adelaide | Dec 1951 | (Lost) |
| 90 | at Port of Spain | Mar 1978 | (Lost) |
West Indies
| 51 | at Port of Spain | Mar 1999 | (Lost) |
|---|---|---|---|
| 78 | at Sydney | Jan 1952 | (Lost) |
| 82 | at Brisbane | Nov 2000 | (Lost) |
| Total individual 100s | ||
|---|---|---|
| Total 100s | 213 | (in Australia: 108, in West Indies: 105) |
| By Australia | 110 | (in Australia: 54, in West Indies: 56) |
| By West Indies | 103 | (in Australia: 54, in West Indies: 49) |
Highest individual scores
Australia
| 242 | by Doug Walters | at Sydney | Feb 1969 | (Won) |
|---|---|---|---|---|
| 223 | by Don Bradman | at Brisbane, Exhibition | Jan 1931 | (Won) |
| 216 | by Dean Jones | at Adelaide | Feb 1989 | (Drawn) |
West Indies
| 277 | by Brian Lara | at Sydney | Jan 1993 | (Drawn) |
|---|---|---|---|---|
| 226 | by Gordon Greenidge | at Bridgetown | Apr 1991 | (Won) |
| 226 | by Brian Lara | at Adelaide | Nov 2005 | (Lost) |
Leading run-getters
Australia
| 2192 by Steve Waugh in 32 mts | 51 inns | ave 49.82 |
|---|---|---|
| 2052 by Allan Border in 31 mts | 59 inns | ave 39.46 |
| 1977 by Ricky Ponting in 24 mts | 44 inns | ave 53.43 |
Most runs in Australia: 1256 runs by Allan Border in 21 mts, 40 inns, ave 33.95
West Indies
| 2815 by Brian Lara in 30 mts | 56 inns | ave 52.13 |
|---|---|---|
| 2266 by Viv Richards in 34 mts | 54 inns | ave 44.23 |
| 2233 by Desmond Haynes in 33 mts | 59 inns | ave 42.13 |
Most runs in Australia: 1760 runs by Viv Richards in 22 mts, 39 inns, ave 47.57
Most individual 100s
Australia 7 by Steve Waugh & Ricky Ponting (in Aus: 4 by Ian Redpath, Doug Walters & Greg Chappell)
West Indies 9 by Richie Richardson & Brian Lara (in Aus: 5 by Clive Lloyd)
Best bowling in an innings
Australia
| 8/71 | by Graham McKenzie | at Melbourne | Dec 1968 | (Won) |
|---|---|---|---|---|
| 8/87 | by Merv Hughes | at Perth | Dec 1988 | (Lost) |
| 8/112 | by Geoff Lawson | at Adelaide | Dec 1984 | (Lost) |
West Indies
| 7/25 | by Curtly Ambrose | at Perth | Jan 1993 | (Won) |
|---|---|---|---|---|
| 7/54 | by Andy Roberts | at Perth | Dec 1975 | (Won) |
| 7/55 | by Gerry Gomez | at Sydney | Jan 1952 | (Lost) |
Best bowling in a match
Australia
| 13/217 | by Merv Hughes | at Perth | Dec 1988 | (Lost) |
|---|---|---|---|---|
| 11/79 | by Bert Ironmonger | at Melbourne | Feb 1931 | (Won) |
| 11/96 | by Allan Border | at Sydney | Jan 1989 | (Won) |
West Indies
| 11/107 | by Michael Holding | at Melbourne | Dec 1981 | (Lost) |
|---|---|---|---|---|
| 10/107 | by Malcolm Marshall | at Adelaide | Dec 1984 | (Won) |
| 10/113 | by Gerry Gomez | at Sydney | Jan 1952 | (Lost) |
Leading wicket-takers
Australia
| 110 by Glenn McGarth in 23 mts | ave 19.38 |
|---|---|
| 65 by Shane Warne in 19 mts | ave 29.95 |
| 64 by Brett Lee in 12 mts | ave 23.00 |
West Indies
| 135 by Courtney Walsh in 38 mts | ave 28.68 |
|---|---|
| 128 by Curtly Ambrose in 27 mts | ave 21.23 |
| 103 by Lance Gibbs in 24 mts | ave 31.28 |
Overall Test record
Australia (1877 to 2015)
| Venue | Mts | Won | Lost | Tie | Draw | %win |
|---|---|---|---|---|---|---|
| Home | 401 | 228 | 95 | 1 | 77 | 56.86 |
| Away | 382 | 140 | 113 | 1 | 128 | 36.65 |
| Total | 783 | 368 | 208 | 2 | 205 | 47.00 |
West Indies
| Venue | Mts | Won | Lost | Tie | Draw | %win |
|---|---|---|---|---|---|---|
| Home | 233 | 84 | 57 | 0 | 92 | 36.05 |
| Away | 277 | 80 | 118 | 1 | 78 | 28.88 |
| Total | 510 | 164 | 175 | 1 | 170 | 32.16 |